I asked a road-geometry agent to check a curve designed for 80 km/h. It came back with 250 meters, the exact minimum radius the manual lists for that speed. It was also wrong. On that alignment, 250 meters was the floor only if you ignored what the road did on either side of the curve.
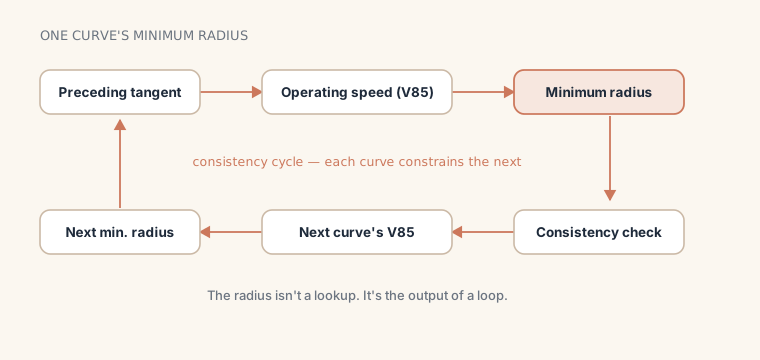
I had already handed the agent the manual and told it to work like a road engineer. It could pull up the table and explain it cleanly. What it couldn’t see was the chain that moves the number. Let the straight before the curve run long and the operating speed climbs past the posted one, and the minimum climbs with it, to 330, then 425. Tighten the next curve and a consistency check can push it up again. Telling the model to be an expert gave it fluent language. It didn’t give it the conditions that decided the case.
It took building a few of these agents to see what the reflex gets wrong. The manual goes into the model easily. What falls out is the structure its prose was carrying: the way each value depends on the others.
What “load the manual” usually means
When you want an agent good at something specific, the instinct is to feed it the source. PDF in, knowledge base out. Chunk the document, embed the chunks, pull the closest few into context at question time. That’s the RAG playbook, and for plenty of tasks it’s the right one.
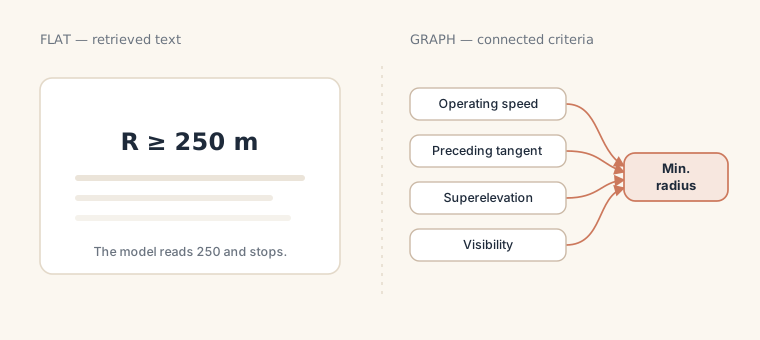
It also quietly drops the most useful thing in a technical manual. The values come through fine; what gets lost is how they condition each other. A standard is a web of dependencies. The minimum radius depends on the operating speed, the operating speed depends on how long the preceding straight is, the superelevation you pick changes the radius you can use, and a sight-distance rule can override all of it. Flatten that into passages you retrieve and the model gets the sentences back, then answers as if the table were the end of the question. It hands you 250 and stops.
What the structure changed
So we stopped storing these manuals as text and started storing them as a graph of criteria, each value wired to the ones that move it. The structure bought one thing that mattered: we could check our own work. A verdict could be traced back to the exact rule that governed it, and a contradiction in our own reading of the manual showed up before it became a default.
I’ll be straight about the evidence before the cases: I don’t have an A/B benchmark, no “flat scored X, graph scored Y” across a hundred runs, and on easy questions I doubt it would show much, since a plain lookup is exactly where the graph is overhead. What I have is two real, hard cases where the structure paid for itself.
On EUCLIDES, our road-geometry agent, running it against a real alignment exposed a rule we had encoded too conservatively. For a short straight before a curve, we had carried the previous curve’s operating speed straight through. The manual doesn’t do that; it resolves the case through the relation between the two curves’ radii. We caught it and corrected the rule before treating the agent’s verdict as final. That pulled a false positive out of the knowledge base before it could propagate into later reviews. In checking the road, the graph had also flagged one of its own rules.
On APELES, our brand agent, the same approach in a completely different domain, the subject was a one-color logo we were about to approve. The mark held at 48 px, reached its limit at 32, degraded at 24, and failed at 16 px as the left counter closed in. We stopped the approval and required a reduced variant. Something that would have been waved through by eye had become a release condition with a number on it.
When flat is fine
This is more work than chunk-and-embed, and it isn’t always worth it. If the agent’s job is to find and quote passages, search a contract for a clause, pull a definition, retrieval over flat text is the right tool and the graph is overhead. The structure earns its cost when the question is a judgment: when the answer depends on conditions, when criteria pull against each other, when the common answer and the correct answer for this case are not the same. That is exactly where a model left to its own statistics hands you the average answer with confidence.
We’ve since built the same kind of graph for road drainage, aerodrome design, brand, document production, and contract law. Each became its own narrow specialist, reasoning from criteria rather than from a persona we assigned it.
Result: one over-strict geometry rule caught and corrected before it spread, and one logo stopped before approval at the exact size where it broke. We still use retrieval for lookup and quotation. But when an agent has to make a judgment, its answer has to keep the conditions the source attached to it, and stay traceable back to them. That is the part telling a model to act like an expert never did for us.